Finding similar players: Cosine similarity, Euclidean Distance & Pearson Correlation

People often ask me what gives me the most joy about working in football and I honestly can remember when I gave the same answer twice. It’s an incredibly dynamic world, and I love so many aspects of it. Sometimes it’s also that I just love everything and that’s part of my shortcomings. However, I missed writing about specific scouting topics and I decided to combine mathematical concepts with finding a particular player. Let’s look at player similarities.
Player similarities can give us an insight not only into the player of similar quality but also give us an indication of the similar playing style a player might have.
In this article, I will look at similar players to Mohammad Salah from Liverpool playing in the Premier League. Not only will I find some similar players, but I will be using three different ways of doing that:
- Cosine Similarity
- Euclidean Distance
- Pearson Correlation Coefficient.
These three concepts will be explained prior to the actual analysis of this article.
Data
For this analysis, I’m using Wyscout data from the 2024–2025 season which consists of the Premier League. These have been collected on December 27th, 2024 so some of the data can be outdated as of when you are reading this article.
This can obviously be done with other data sources such as Statsperform/Opta, Statsbomb and many others, but these are the sources I’m using. I’m filtering the players for attackers who have played at least 500 minutes to make it all a bit more representative.
Cosine Similarity
Cosine similarity measures the similarity between two vectors by computing the cosine of the angle between them. It is calculated by taking the dot product of the vectors and dividing by the product of their magnitudes. The resulting value ranges from -1 to 1, though in most practical scenarios (especially in text analysis), it ranges from 0 to 1. A higher value indicates greater similarity.

Cosine similarity is scale-invariant, meaning that scaling a vector does not affect its similarity. As seen above, it is about the angle rather than the distance of the two points. It is widely used in natural language processing, information retrieval, recommendation systems, and clustering for measuring the resemblance between data points.
Euclidean Distance
The Euclidean distance is a fundamental metric in mathematics and data science that measures the straight-line distance between two points in Euclidean space. It is derived from the Pythagorean theorem, which states that the square of the hypotenuse of a right triangle equals the sum of the squares of the other two sides. The Euclidean distance is the square root of the sum of squared differences between corresponding coordinates.

This measure captures how far apart two points are, which makes it useful in various tasks such as clustering, classification, and anomaly detection. Unlike some other distance metrics, Euclidean distance is sensitive to scale and does not directly account for direction.
Pearson Correlation Coefficient
The Pearson correlation coefficient is a statistical measure that quantifies the strength and direction of the linear relationship between two continuous variables. Mathematically, it is defined as the ratio of the covariance of the two variables to the product of their standard deviations.
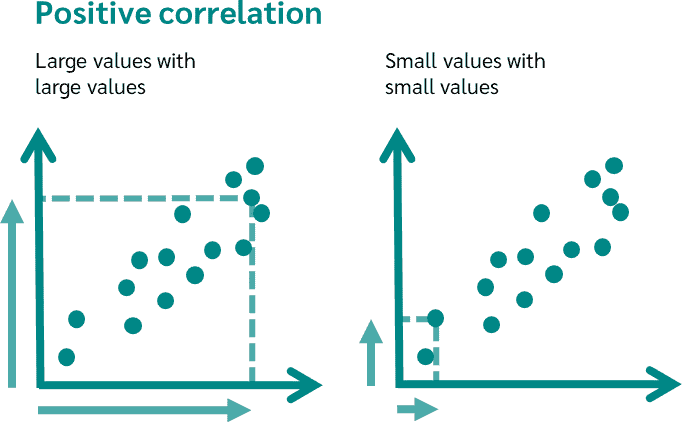
Its value ranges from -1 to +1, where -1 indicates a perfect negative linear correlation (as one variable increases, the other decreases at a proportional rate), +1 signifies a perfect positive linear correlation (both variables move together in the same direction proportionally), and 0 indicates no linear relationship. Because it captures only linear relationships, a high or low Pearson correlation does not necessarily imply a cause-and-effect relationship or any non-linear association.
+-------------------+--------------------------------+-----------+-----------------+---------------------------+
| Metric            | Definition                       | Range     | Scale           | Key Usage                 |
|                   |                                  |           | Sensitivity     |                           |
+---------------------------------------------------------------------------------------------------------------+
| Cosine Similarity | Cosine of angle between vectors  | -1 to +1  | Scale-invariant | Text analysis,            |
|                   |                                  |           |                 | recommendations          |
+---------------------------------------------------------------------------------------------------------------+
| Euclidean Distance| Straight-line distance           | 0 to +∞   | Scale-sensitive | Clustering,               |
|                   | in n-dimensional space           |           |                 | nearest-neighbor          |
+---------------------------------------------------------------------------------------------------------------+
| Pearson           | Measures linear                  | -1 to +1  | Scale-invariant | Stats, data science       |
| Correlation       | relationship                     |           |                 |                           |
+-------------------+----------------------------------+-----------+-----------------+---------------------------+
In the table above you see the three different metrics compared to each other. I wanted to show and compare these different ways of looking at similarities as it will lead to different results in actually finding similar players. Let’s have a closer look.
Similar players
As said above, we will look at the Premier League to find similar players for Mohammad Salah based on playing style and intention. Using the three different methods we get these results:


The first things that we can conclude from this is that there are different ways of calculating similarity and these numbers are different. The similarities in Cosine Similarity are bigger in the distance between players, while with Pearson Correlation the distances are smaller but there are less big similarities. The Euclidean distance works with different ways of counting similarities, so you mostly see the same players, but the similarity number is much much lower.
The second thing you can see is that it lists almost the same players, however, the ranking shifts. Haaland for example is the 7th most similar player in Cosine Similarity, not in the top 15 with Euclidean Distance and 6th with Pearscon Correlation. If you base your findings on rankings, it is important to stress that the method of calculation will manipulate the data and influence decision-making.